From nightmare to method
Sometimes you only realize in the middle of things how far you’ve strayed from the course. In October 2022, I started a project that was supposed to be completed in November 2023. But what began as a manageable undertaking quickly turned into a real nightmare. By May 2023, only 30% had been completed, and the realization hit me like a bolt of lightning. With weekly 80-hour shifts, we pushed forward to save the start of commissioning in early September 2023. The missing documentation and lack of tests led to a marathon of bug fixes that kept us going at a constant 80 hours in the following weeks until acceptance in November. We only just managed to finish on time and ended up spending almost twice as many hours as planned. Naturally, those hours were then missing elsewhere. We felt the aftereffects until mid-2024. Having hit rock bottom in terms of poor planning, and despite a massive workload in other projects, we immediately introduced a comprehensive time tracking and planning tool. The implementation essentially took only two months, December 2023 and January 2024, and was one of the best decisions we have ever made at AutoLab.
Everything you see below was essentially built by my wife and me over eight weekends. So it doesn’t take a huge organizational effort to achieve enormous improvements.
Long story short: Let’s take a look at how we did it and how you can do the same.
Introduction of tools and methods
Since we were already using Atlassian products
- Confluence as a knowledge base
- Jira for project planning
- and Bitbucket for our code management
it was an obvious choice for us to use these tools. Unfortunately, up to that point we had only used Jira in a very rudimentary way, mostly just for assigning tasks. What was completely missing was a quick way to perform target vs. actual comparisons between planned and already logged hours within projects. There was also no overview of overall workload and capacity. Even more critical was that the planned workload per employee could not be retrieved at the push of a button.
I wanted a system that would provide me with the following at the push of a button:
- How many total hours were spent on client projects during the requested time period? Client projects are projects that we sold at a fixed price. Additional effort therefore means an immediate financial loss.
- How many hours were spent per project?
- How many hours were spent on consulting, services, or support? These are services that the client pays for on an hourly basis.
- The listing of these service hours must be exportable at the push of a button, including detailed descriptions, so that they can be passed on to the client with 100% transparency.
- How many hours were spent on internal developments such as libraries or prototypes? These are hours that represent valuable long-term contributions to the company’s success but must be borne internally. The classic example here is research and development.
- How many hours were “wasted” on general activities?
- How are these general hours broken down in detail? In other words, how much time was spent on marketing, recruiting, project inquiries, etc.?
We therefore divided all entries into the following categories:
- Projects
- Project A
- Project B
- …
- Services
- For client A
- For client B
- …
- General hours
- General tasks
- Recruiting
- Marketing
- Project inquiries
- Sales
- Training others
- Training & onboarding
- Internal developments
- Internal Project A
- Internal Project B
- …
This gives us four main categories, each with several subcategories.
The question that remains is: How do we best implement this in Jira?
Creating a project template
In Jira, we use Scrum projects (see Space templates/Software development/Scrum):
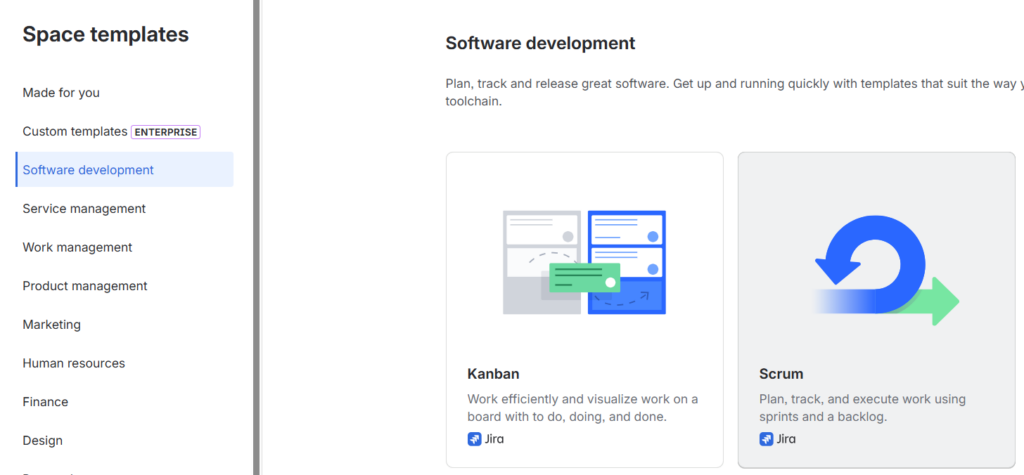
At this point, I can only recommend that everyone read my post Perfectionism as Poison and also follow my book recommendation by getting the book “Scrum: The Art of Doing Twice the Work in Half the Time” by Jeff Sutherland and J.J. Sutherland. This article will already reach a considerable length anyway, so I will not go into Scrum in more detail. The subsequent analysis of logged time using Tempo would work just as well with other project types in Jira.
If you want specific workflows, it is advisable to create your own template for projects. For example, instead of
- TODO
- In Progress
- DONE
we use the workflow steps
- TODO
- In Progress
- In Review
- DONE
Such and other settings are stored in our ProjectTemplate project. When creating a new Jira project, we “inherit” from it:
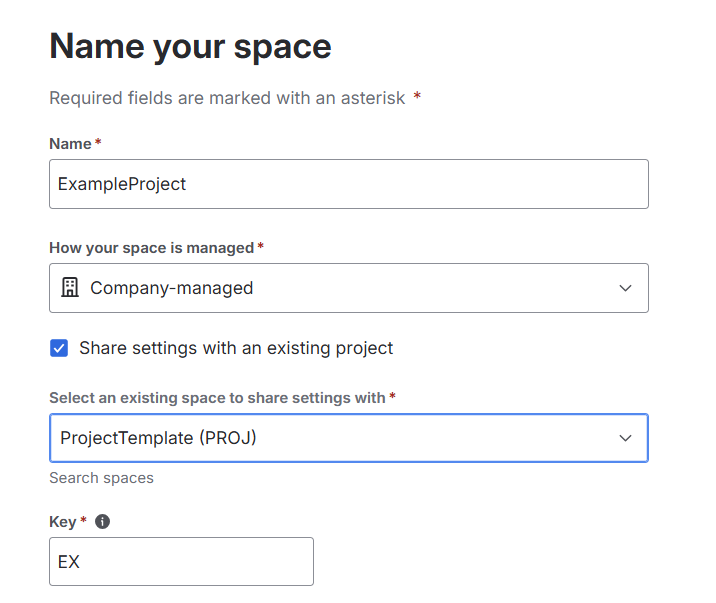
And just like that, a new project with our desired default settings is created.
Allocating hours correctly
A specific project now only needs to be assigned to one of our four main categories. To do this, we go to the “Space Settings” in the respective project—or now also called a Space in Jira—and assign the project to one of our four main categories:
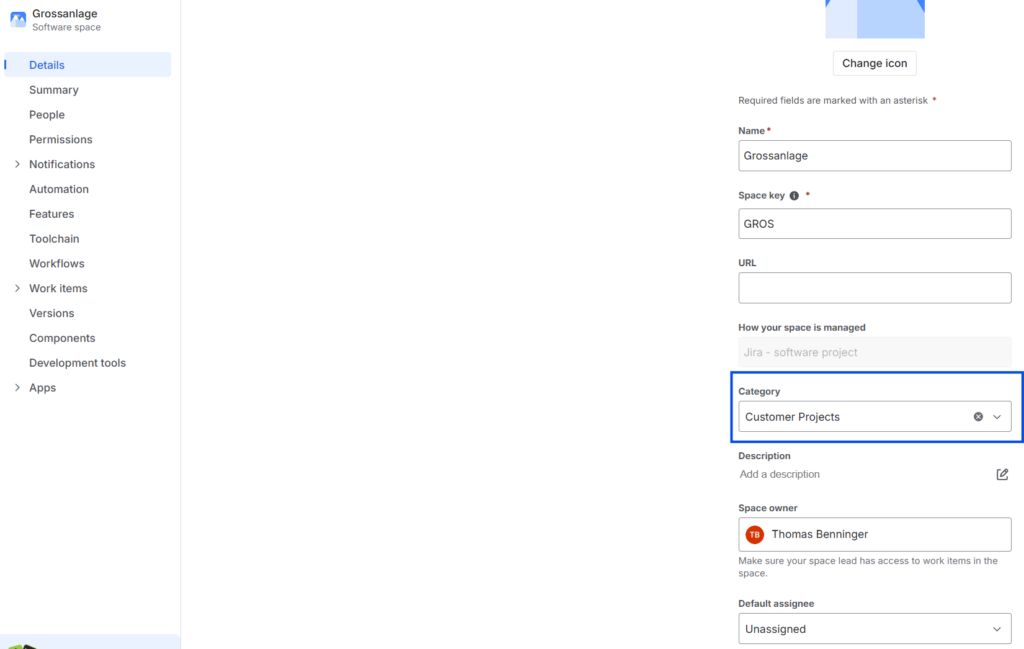
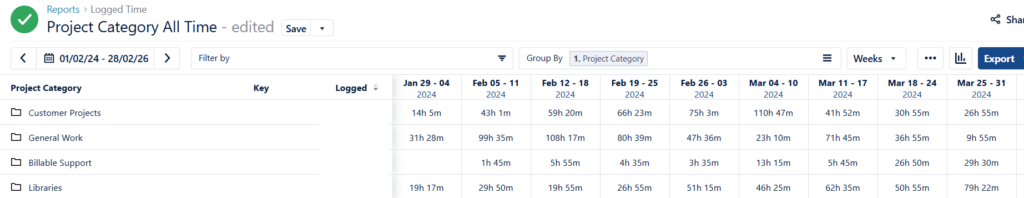
And that’s all there is to it. Later, we can filter by our project categories and create reports accordingly.
For general hours, we make things even easier by implementing the breakdown using epics within a project called “General Hours.”
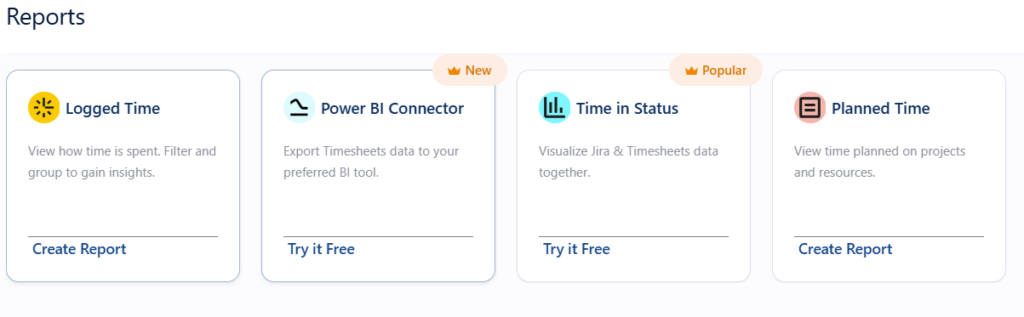
After that, you just need to get the Tempo application from the Atlassian Marketplace, and planning can begin.
Planning time and capacity
Of course, you also need to configure a few settings in Tempo afterward. For example, you need to enter public holidays depending on the country of use and define the respective working time models of the employees. In our case, we currently have about two different part-time models for students, while everyone else is on a full-time model. I won’t go into more detail here, as my wife and I found our way very well at the time using Tempo’s documentation and guides. You simply have to “work through” them.
Once the application has been successfully set up, you can start planning. To do this, simply go to the respective project board and create epics and issues there:
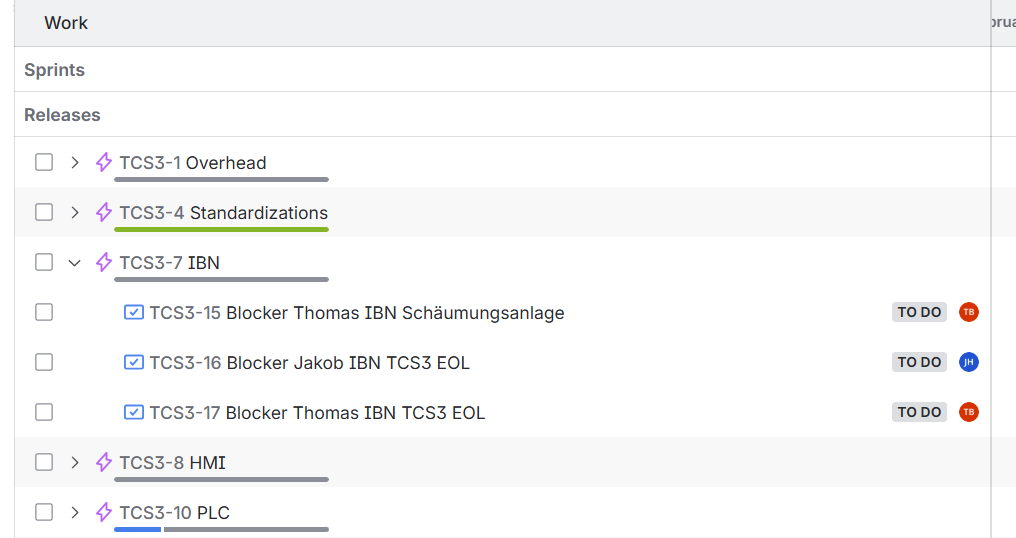
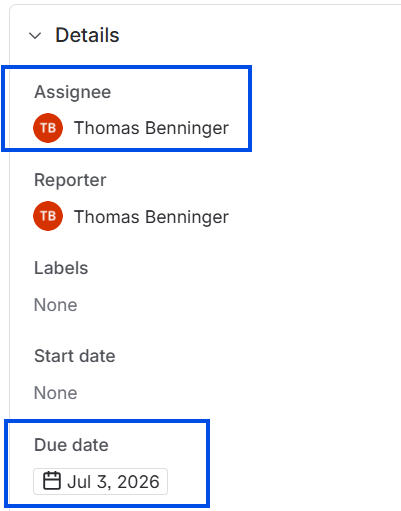
You then need to assign three things to these issues so that Tempo can process them:
- Who is responsible for completing the task?
- By when does the task need to be completed?
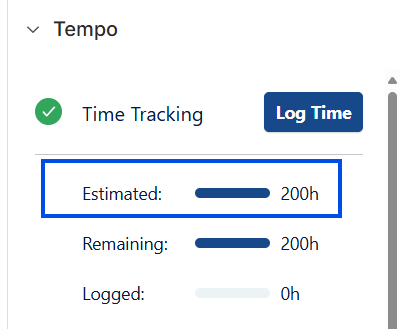
- How many hours are estimated for it?
Here’s an example of how I assigned a time block to myself for the initial rough planning:
Later, this naturally needs to transition into more detailed planning. In my opinion, the maximum limit for a single task is 80 hours. However, I would rather recommend 40 hours.
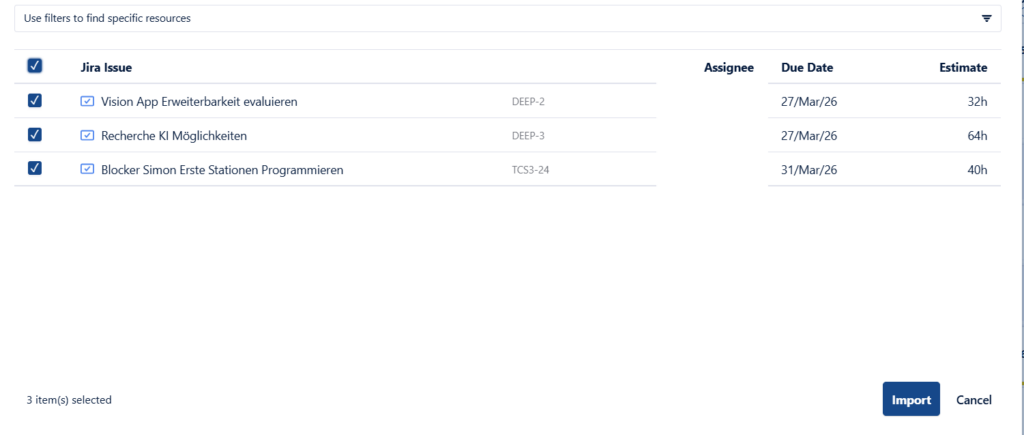
Once you have completed these three things, you can already import the whole setup into Tempo:
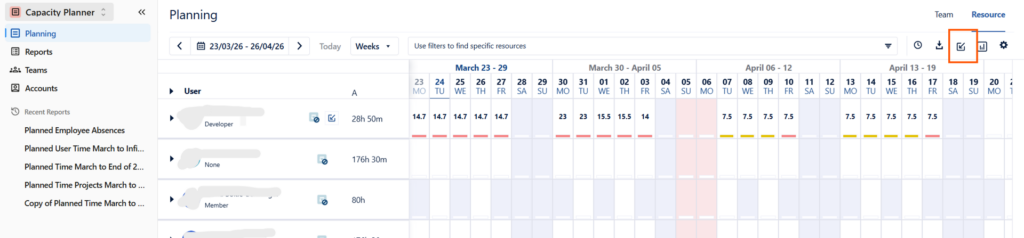
Macht man das konsequent für alle Projekte, ist die Kapazitätsplanung ein Kinderspiel. Man geht in Tempo einfach auf „Reports“ und wählt dort „Planned Time“ aus:
Then you simply select the desired observation period, and the report is ready.
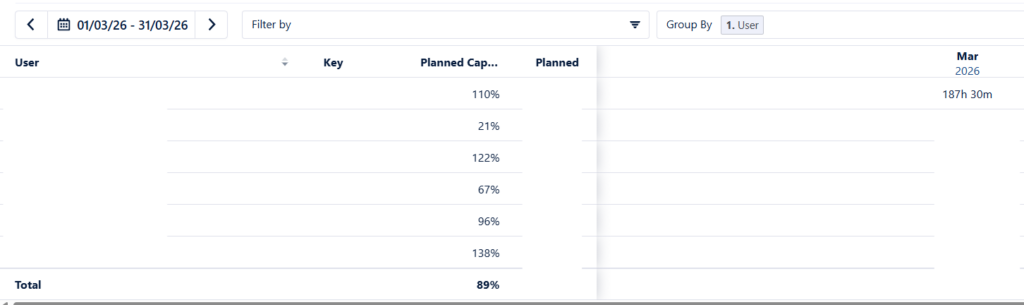
Since I never explicitly plan general hours, my recommendation is to never plan utilization above 80% in principle. Due to an absence caused by a hospital stay, most employees were scheduled for more hours than their capacity allows in this particular month. Of course, this should remain the exception. Thanks to Tempo, however, this becomes visible early on, allowing you to respond in a targeted manner.
Detailed reporting
Once the workflow has been set up, everything else is just a click away. You can now reap the rewards of your work and obtain detailed reporting.
What used to take several hours and many manual steps now happens with a single click: all four categories and their logged hours are displayed automatically and clearly.
With another click, I export them to Excel and automatically transfer them via a script into my respective monthly report, which I prepare in PowerPoint.
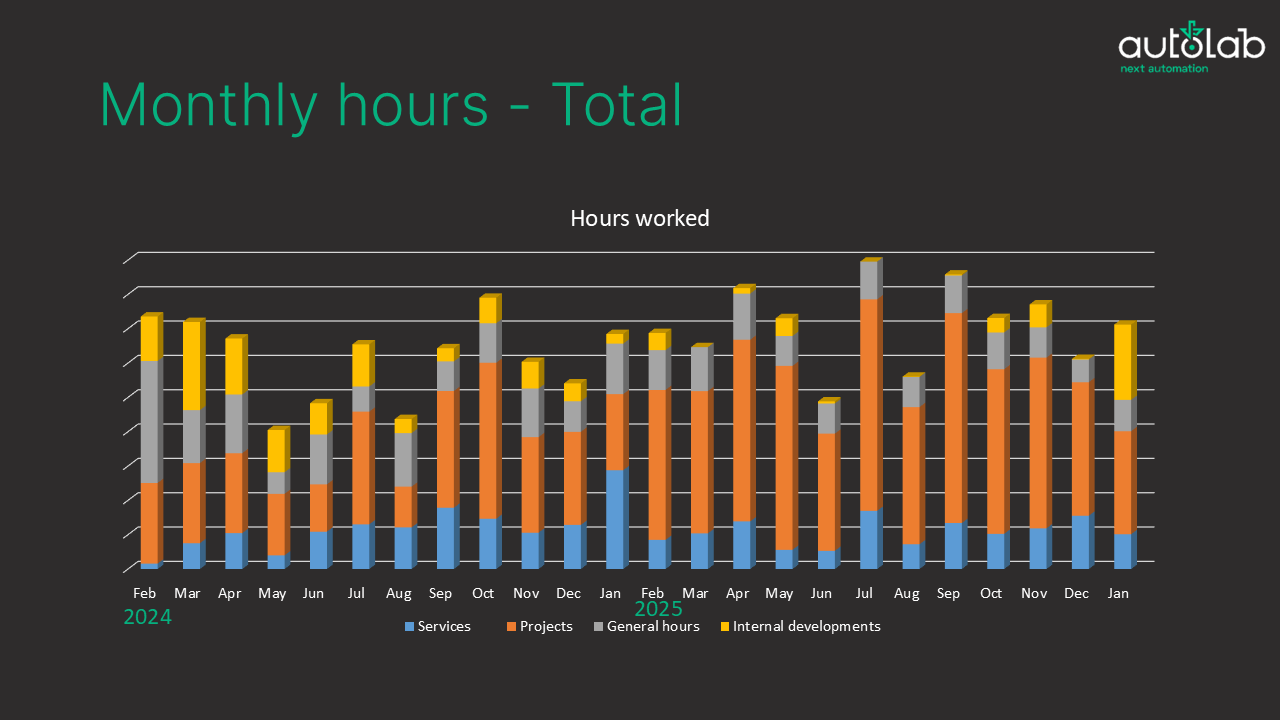
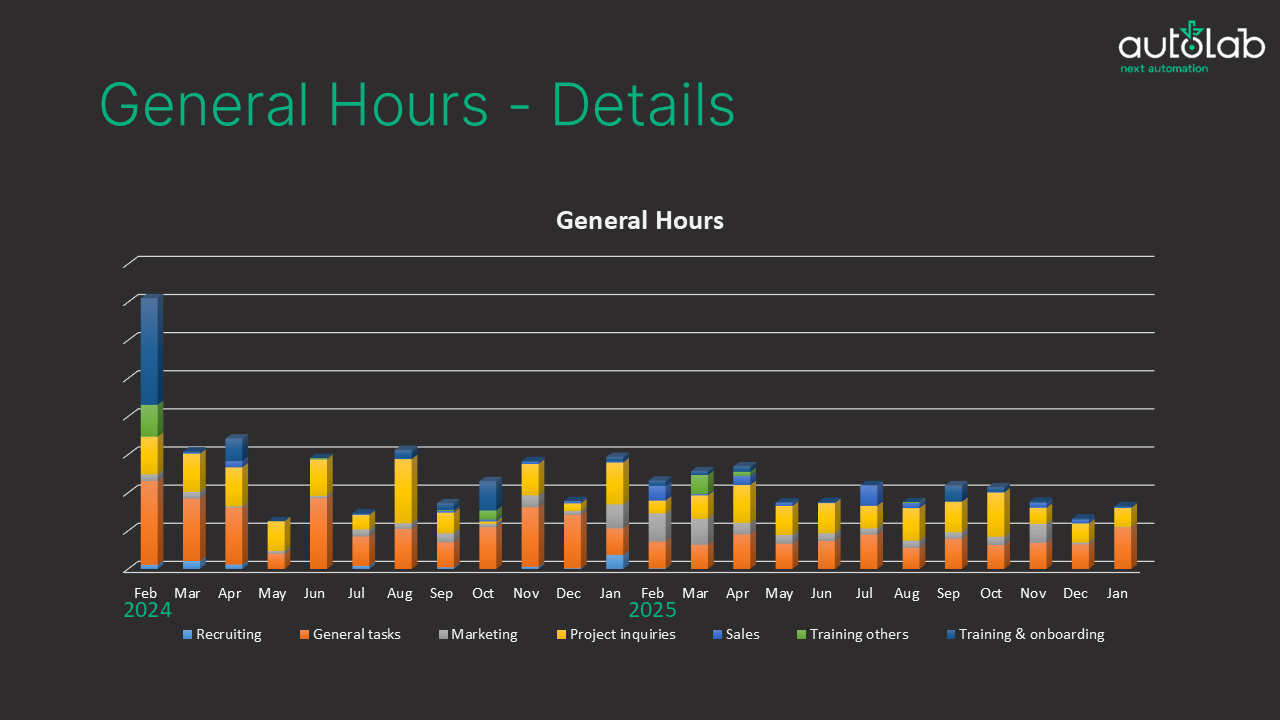
Note: The y-axis intentionally does not display absolute values, as I do not necessarily want to share them and they are not relevant for the article.
In the past, my decisions were often based on intuition; now they are based on clear facts and data. What I definitely had to acknowledge here:
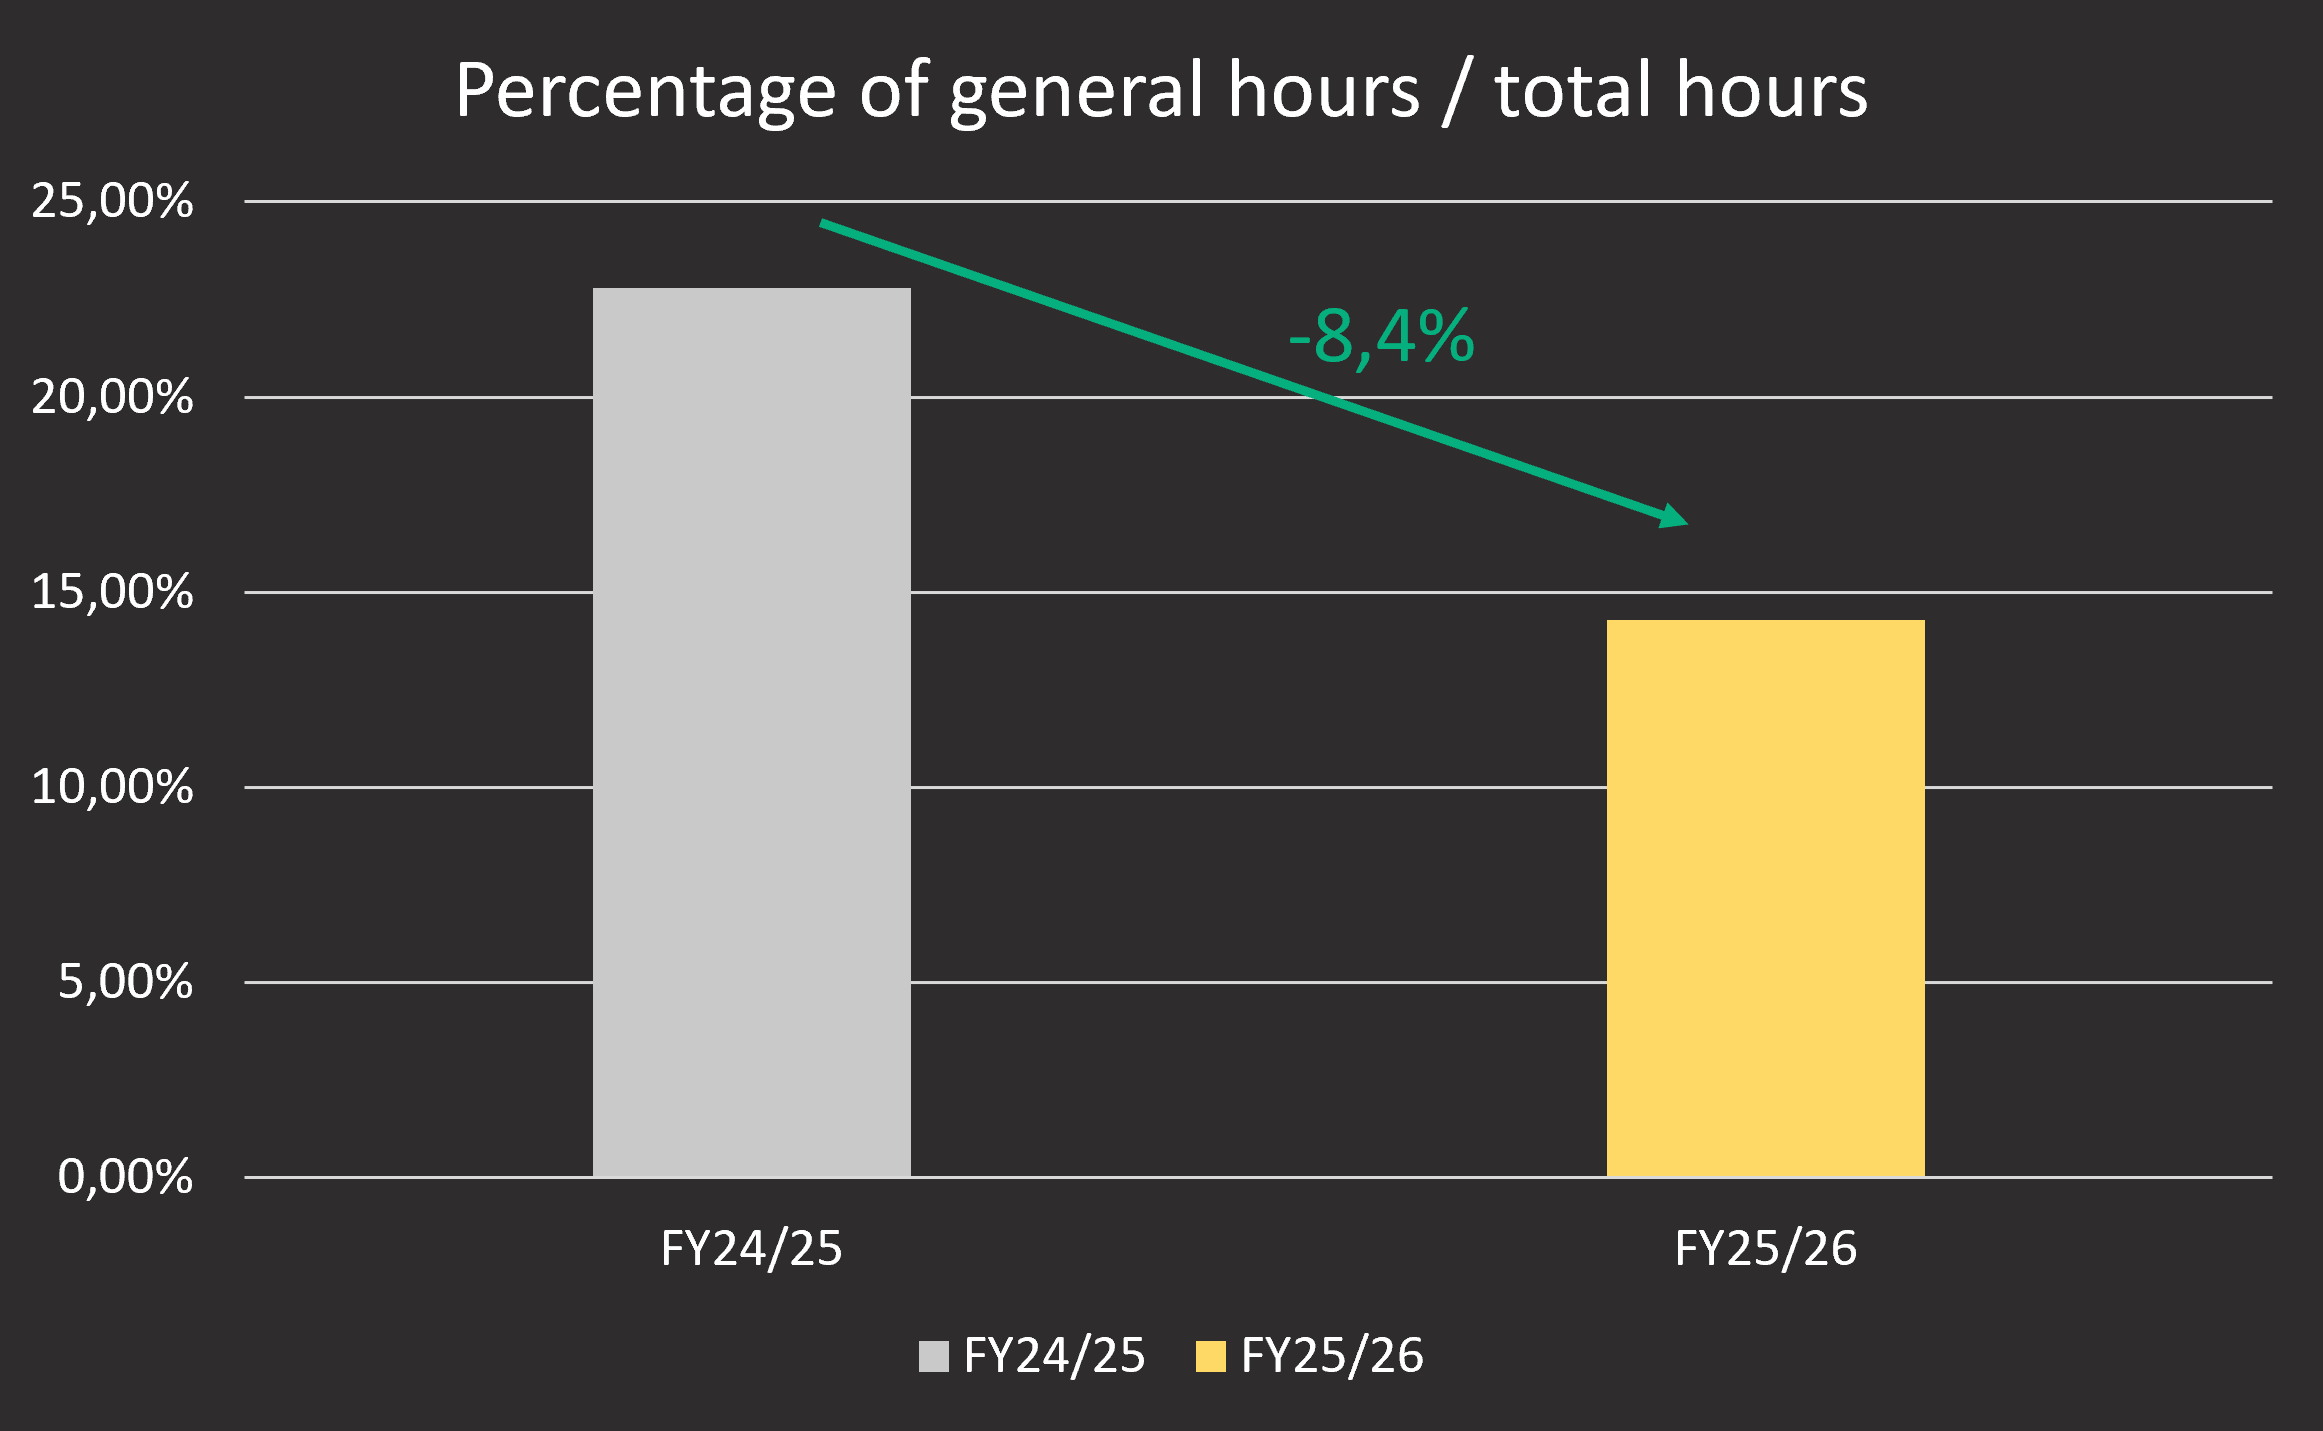
My subjective gut feeling often doesn’t align with the actual data. Since we are a very small technical team and a lot of the organizational overhead is handled by PMT Holding, which AutoLab is part of, I had the impression that general hours didn’t take up that much time. To my great surprise, however, I found that in the 2024/25 financial year they accounted for a whopping 22.7% of all hours. In my opinion, that was far too much, and something had to change. Afterward, we looked at which marketing activities actually generate reach and how we could better integrate onboarding into existing projects. Many small adjustments were made. The result speaks for itself: we were able to reduce the share of general hours in total working hours from 22.7% to 14.3%.
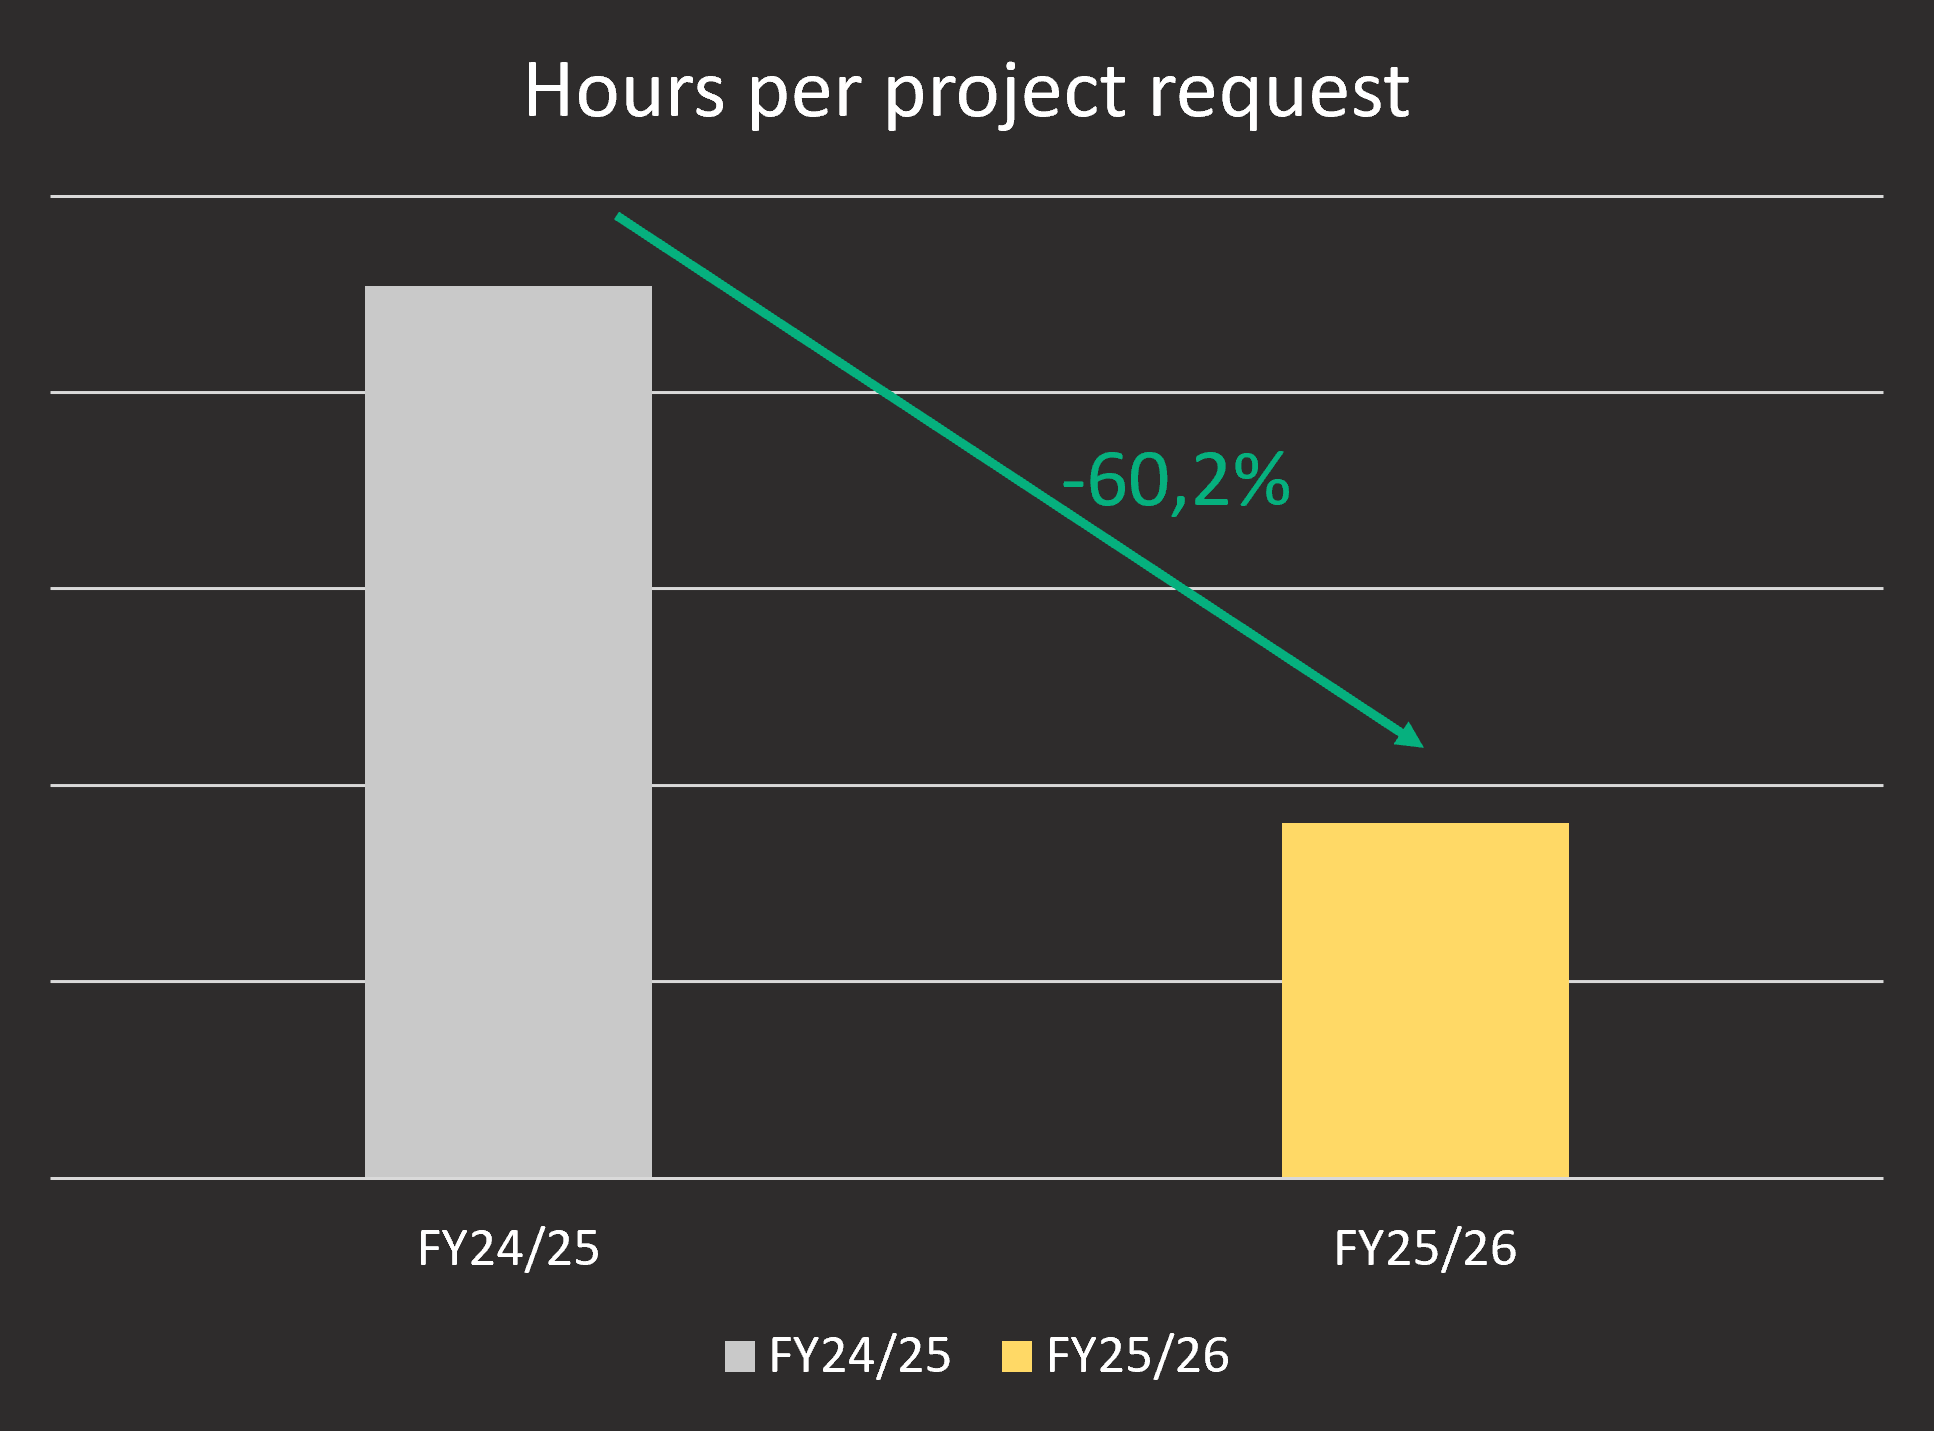
Based on the data, we were able to identify another weak point: in some cases, we were spending too many hours on project inquiries. Especially in image processing, inquiries often come in at a very early stage, when there are no specifications yet and it’s really just about an initial proof of concept. These potential projects are therefore very small-scale with low revenue. If you then invest several days just to process the inquiry, you actually end up losing money, even if you win the contract. So a change was needed here as well.
The following adjustments were made:
- Defining a standardized inquiry process to identify potential early on
- Developing questionnaires to help us work with the client to arrive at clear requirements more quickly
- Faster estimates based on historical data (thanks to Jira/Tempo)
Using these approaches, we were able to reduce the processing time per project inquiry by 60.2%!
Of course, my annual report contains numerous other examples and analyses. However, the two examples mentioned are certainly the most striking—and the ones that are literally saving us time and money.
Why We All Plan Poorly—and What Really Helps
As mentioned at the outset, the intention behind our time tracking and logging was to obtain more realistic assessments. The analysis tools shown earlier also provide enormous added value, but targeted planning can be crucial for a company's survival. If a major project is completely miscalculated, the economic damage can be enormous.
Once again, I would like to take this opportunity to refer to my absolute favorite book, “Thinking, Fast and Slow.” It vividly demonstrates just how incredibly poor we are at estimation and planning. My personal experience from the project mentioned at the beginning is therefore also in line with the scientific consensus. A few examples from the book (from Chapter 23, The Outside View):
- The construction of the Scottish Parliament was originally estimated to cost around 40 million pounds. Over the course of several “final” estimates, the costs rose gradually—ultimately reaching over 400 million pounds.
- An analysis of rail projects spanning several decades shows that passenger numbers were overestimated in more than 90% of cases. On average, forecasts were more than double the actual figures, while costs were, on average, about 45% higher than planned.
- The same pattern holds true even for private projects: U.S. homeowners estimated their kitchen renovations at an average of about $19,000—but actually spent around $39,000.
As it turns out, we humans systematically underestimate the effort required for projects. That’s exactly how I felt at the beginning with AutoLab.
Fortunately, both Thinking, Fast and Slow and its follow-up, Noise, describe how to protect yourself from such misjudgments. The topic is a rabbit hole in itself—you could easily spend days exploring it. I’ll therefore keep this brief and focus on what I consider the most effective method: estimating based on base rates.
The idea is simple: instead of making estimates “off the top of your head,” you base your calculations on actual data from comparable projects. For example, you take the average costs or workloads of similar rail projects and then slightly adjust them to fit your own circumstances.
That’s exactly how we handle project costs today. Thanks to our time tracking down to the minute, we now have an excellent database.
When we receive a request today for a 3D scan using two laser profilers, we look at a similar project we’ve already completed. Let’s say that project took 240 hours. We then assess the differences—such as the geometric complexity of the component. If the new part is more complex, we add a 25% buffer, for example, and arrive at around 300 hours.
In practice, it has since become very clear that this offers several advantages:
- The estimates are significantly more accurate than they used to be
- The estimates are significantly more accurate than they used to be
- Our customers receive reliable quotes faster
I highly recommend that everyone base their estimates on data in this way.
Project Monitoring
Another phenomenon that is frequently observed in projects is what is known as Parkinson's Law:
Work expands to fill the time available for its completion.
Or, to put it simply: If I budget 100 hours for a task, it will most likely take 100 hours—even if, in theory, it could be completed in 70 hours.
The reasons for this are hardly surprising:
- People tend to be less focused because there is no real time pressure
- Tasks become unnecessarily complex (“overengineering”)
- Perfectionism creeps in
- Decisions are postponed
This is exactly where good project monitoring becomes crucial. In the past, it was essentially a blind flight for us. Once planned, we just hoped it would somehow work out. If it didn’t, we usually realized it too late.
Heute ist das komplett anders. Dank Jira und Tempo haben wir jederzeit einen Echtzeit-SOLL-IST-Vergleich auf allen Ebenen. Ich sehe zu jedem Zeitpunkt:
- How many hours were planned?
- How many have already been booked?
- Where are we going off track?
However, what matters most is not transparency alone, but what we do with it. As soon as we see a task starting to get out of hand, we take proactive action. This may mean:
- Narrow the scope
- Redefine tasks
- Consciously accept a “good enough” solution
- Or, if in doubt, refine it early on
So we continuously make adjustments to stay on track, rather than being caught off guard at the end.
In Kombination mit kürzer geschnittenen Tasks (ideal < 40 h) entsteht dadurch ein sehr robuster Regelkreis: planen → umsetzen → messen → nachjustieren.
And that is precisely what prevents workloads from spiraling out of control in practice.
More than just internal: Direct benefits for customers
One aspect that is often underestimated is the direct value it adds for the customer.
Since we have to assign every task to an issue anyway, and Tempo is configured so that time cannot be logged without a comment, this automatically results in a complete, minute-by-minute record.
This can be exported at the touch of a button and made available to the customer with full transparency.
In my view, this is the fairest and most transparent solution, especially when it comes to consulting services, support contracts, or traditional hourly packages. The client can see exactly what the time was spent on, with no room for interpretation.
Another advantage becomes apparent during the course of the project. For example, when a client books a 100-hour consulting package, it typically covers several topics. In practice, it often turns out that certain tasks require significantly more effort than originally anticipated due to unclear requirements or missing information.
Thanks to our monitoring, we identify such developments at a very early stage and communicate them proactively.
This is consistently very well received by our customers because our internal project monitoring indirectly helps them better manage their own projects as well.
Conclusion and outlook
At the end of the day, it’s clear that our time-tracking system has several distinct benefits:
- Significantly better project planning and far fewer unpleasant surprises
- Faster quote generation and, as a result, noticeably better customer service
- Close, data-driven project monitoring
All of this adds up to significant time and cost savings. Even for a small team like AutoLab, we’re quickly talking about low six-figure savings in internal costs per year.
And in my view, that’s just the beginning. The more data we collect, the better our decisions become—and the stronger this effect becomes.
Leave a Reply